Key Mutual Fund Ratios Explained: A Complete Guide for Smart Investors
Mutual funds have become one of the most popular and beginner-friendly ways to invest money in India. With over 50 Asset Management Companies (AMCs) and thousands of mutual fund schemes available, it’s no surprise that investors often find it tricky to pick the right one. After all, how do you know which fund is actually performing better?
That’s where key mutual fund ratios make all the difference. These ratios help you go beyond just returns; they tell you how much risk a fund is taking, how consistent its performance is, and how it stacks up against its benchmark and peers.
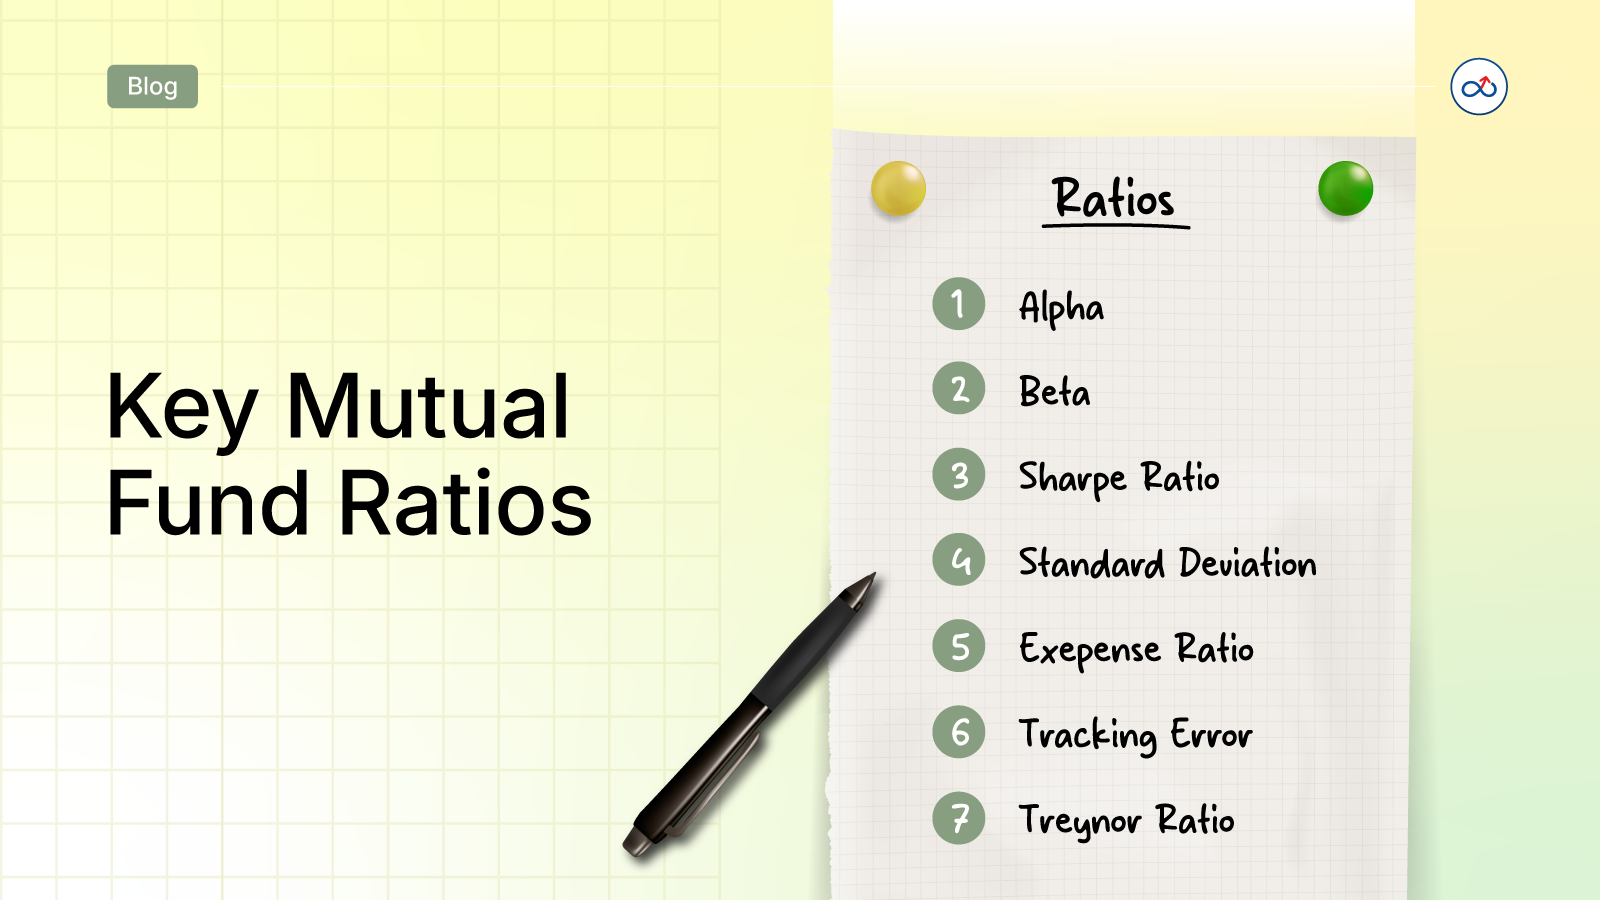
In this article, we’ll break down the most important mutual fund ratios every investor should know. By the end, you’ll have a clearer idea of how to evaluate different mutual funds and choose the one that truly fits your goals.
Alpha
Alpha is one of the most commonly used mutual fund ratios. It measures a fund’s performance compared to its benchmark. Alpha of 0 indicates that the fund has delivered exactly the same return as the benchmark. Alpha greater than 0 shows that the fund manager has delivered higher than market/benchmark return and therefore the fund manager's strategy is effective, it has been able to beat the market returns.
Alpha simply shows you if you are better off or not, by investing in a particular fund rather than the benchmark. A negative Alpha shows underperformance compared to benchmark and falling short of expectations.
Alpha = (Mutual fund return – Risk free return) – [(Benchmark return – Risk free return) * Beta]
Beta
Beta is a measure of a fund’s volatility compared to market movements. In simple terms, it measures how the fund moves with the market ups and downs. Ideal Beta of the market is 1, this ratio shows correlation of the fund with the market and its sensitivity to market volatility. A Beta of less than one indicates that the fund is less volatile compared to its benchmark and a Beta greater than 1 indicates higher volatility compared to markets.
Beta = (Mutual fund return – Risk free return) / (Benchmark return – Risk free return)
Suppose a fund scheme’s return is 15% and benchmark return is 10%, risk free rate of return is 5%.
Beta = (15-5) / (10-5) = 2
A Beta of 2 indicates the fund is more volatile compared to the benchmark.
Alpha = (15-5) / (12-5)*2 = 2.8
Alpha of 2 indicates the fund has well outperformed the benchmark.
Sharpe Ratio
While comparing a fund’s performance, it is important to understand how much risk it has taken to deliver return. Sharpe ratio is a measure of a fund’s risk adjusted return. It indicates how much return a fund generates for the amount of risk it takes.
A higher ratio indicates better risk adjusted return than a low Sharpe ratio. A negative Sharpe ratio indicates a high level of risk for the same amount of return that a fund would generate without taking that much risk.
Formula for Sharpe ratio is:
Sharpe Ratio = (Average Return - Risk free return) / Standard Deviation of investment
Assume a scheme’s average return is 18%, Risk free return is 5% and Standard Deviation is 10%
Sharpe Ratio = (18 - 5) / 10 = 1.3
This means that the scheme has generated 1.3% excess return for every unit of risk taken.
Funds with a high Sharpe ratio are suitable for investors looking for high return albeit at high risks as well. This ratio can be used to compare schemes for their risk adjusted returns.
Treynor’s ratio
This ratio measures excess return generated by a fund for every unit of risk taken by the portfolio. It indicates how much an investor is rewarded in the fund over risk free return by assuming every unit of risk. TR is an important ratio for investors. Beta forms a part of TR, thus it helps to understand how risky a fund is and how well it pays off every unit of risk as excess return over risk free return.
Thus, the formula for calculating Treynor Ratio (TR) is:
TR = (Portfolio’s returns – Risk-free return) / Beta value of the portfolio
For example, if your portfolio delivered 14% return and risk free rate of return is 5%, the fund’s Beta is 1.1 (higher volatility compared to benchmark).
TR = (14-5) / 1.1 = 8.18
This means that the fund delivers Rs 8.18 reward for each unit of risk.
R Squared
This is an analytical tool that measures how close a particular scheme’s performance is to a benchmark. It does not measure the performance of the fund but only indicates correlation with benchmark. R Squared is measured from 0-100 value with 100 as highest correlation. A 100 value shows that the movements in benchmark are fully replicated in the fund, mostly true for index funds.
Standard Deviation
Standard Deviation is a statistical value that measures the spread or variance of a set of values from the mean value.
In mutual fund parlance, standard deviation measures volatility in a fund’s return. In simple terms, how much returns have deviated from the average value, indicating volatility and risk.
A high standard deviation shows the return values can swing wildly from the mean, and there is higher uncertainty and risk involved. Whereas a low value shows steadiness of returns with less fluctuations, therefore safer.
For example, investors with low risk appetite may prefer a fund with low chances of extreme ups and downs and relatively stable returns; a low standard deviation fund is suitable for such investors.
Sortino Ratio
This ratio measures the risk-adjusted return of an investment. It is a variation of the Sharpe ratio, the difference being that it considers standard deviation of negative returns on an asset known as downside deviations.
The higher the Sortino ratio, the higher is the return per unit of risk assumed by the portfolio manager in the fund.
Tracking Error
Tracking error measures the difference between the returns of a mutual fund and its benchmark index. It shows how closely a scheme tracks or replicates the benchmark it follows.
In mathematical terms, tracking error is the standard deviation of the difference between a portfolio’s returns and its benchmark’s returns over a specific period, expressed as a percentage.
Tracking error of index funds in India is calculated in two ways.
- Tracking error = Return (P) - Return (i)
P=Portfolio
i=Index or benchmark
- Tracking error = Standard Deviation of (P-B)
P=Portfolio returns
B=Benchmark returns
Information Ratio
This ratio measures a fund manager’s ability to beat the benchmark and deliver higher returns relative to the benchmark. It also tries to measure the fund manager’s consistency in doing so. A higher ratio indicates greater consistency of the fund manager in generating higher relative returns.
Information Ratio = (Portfolio Return – Benchmark Return) / (Tracking Error)
Expense Ratio
Expense ratio is the fee a mutual fund charges to investors for managing their investments. It is shown as a percentage of assets managed by the fund. It includes operational costs, management fees, marketing and sales expenses, statutory fees etc.
Expense is charged from the daily NAV of the scheme before the NAV is declared. Expense ratio is published in the fund's factsheet every month. Expense ratios are charges within limits prescribed by SEBI for different types of schemes.
Portfolio Turnover Ratio
This ratio shows how often a fund’s portfolio is changed over the years. It indicates frequency or number of times the fund manager bought and sold securities in the portfolio in a given period.
A high turnover ratio means there is frequent churning of securities with high transaction costs. It can also be indicative of specific market conditions that require fund managers to take action. Investors of a fund with a high turnover ratio expect the fund returns to also match the high churn costs.
To Sum it Up
Mutual fund ratios are powerful tools that help investors look beyond just past returns. By understanding these simple yet insightful metrics, you can evaluate how a fund performs in terms of returns, risk, consistency, cost, and comparison with peers and benchmarks. These ratios make it easier to identify funds that truly align with your investment goals.
If you’re passionate about mutual funds and want to help others make smarter investment decisions, why not turn that interest into a career?
Become a certified Mutual Fund Distributor with AssetPlus Academy, get expert training, practical insights, and start building your own financial distribution business today!
Related posts
.png)
.png)
.png)
Become a Mutual Fund Distributor
Build a thriving career as a Mutual Fund Distributor with AssetPlus Academy’s expert-led training and mentorship.
